Chat on WhatsApp
    Back to Home
    Social & Content Results

    Social & Content Results

    Social is where a brand earns permission to sell. Our content work is built for compounding: a consistent publishing cadence, formats matched to how each platform actually distributes content, and a community layer that turns viewers into repeat buyers. We have run influencer led campaigns for Pizza Hut and Domino's, built content engines for D2C and marketplace brands, and managed always on creator programmes that keep brand recall elevated between launches. These are the outcomes that programme has produced.

    +310%

    Avg. follower growth

    180+

    Assets produced / mo

    6.8%

    Avg. engagement rate

    5.4x

    Organic reach lift

    The content system behind the numbers

    Consistency beats brilliance on social. Every account we run works off a monthly content calendar built from three pillars, produced in batches, and scheduled ahead so publishing never depends on someone having a good idea on a Tuesday morning.

    Content is also never made for one channel only. A single production day feeds reels, marketplace banners, A+ content modules, paid social creative and email headers. That is how we hit 180 assets a month without a proportional increase in cost.

    • Three content pillars per brand: product, proof and perspective
    • Batch production with one shoot day feeding four weeks of output
    • Platform native editing rather than one asset resized everywhere
    • Hook testing on the first three seconds of every video format
    • Monthly performance review feeding the next calendar
    Community management

    Reach without response is a broadcast, not a community. We answer comments and DMs inside a two hour window during business hours, escalate service issues to the right team, and log recurring questions so they become future content.

    • Two hour response SLA on comments and direct messages
    • Sentiment logging so product feedback reaches the founder, not just the inbox
    • UGC identification and rights clearance for paid reuse
    • Monthly community report with top themes and unanswered objections

    How content connects to revenue

    We do not treat social as a standalone metric. Organic content feeds paid creative, paid creative feeds marketplace conversion, and marketplace reviews feed back into content. The reporting shows those connections explicitly so social spend is defensible in a margin conversation.

    • Top organic posts promoted as paid creative within seven days
    • Branded search volume tracked as the leading indicator of content working
    • Landing page and listing conversion measured against content driven traffic
    • Retention flows tied directly to attributable monthly revenue

    Proof from the dashboards

    Platform reporting screenshots with account identifiers removed, plus links to live campaign work.

    Creator campaign dashboard, QSR activation

    Creator campaign dashboard, QSR activation

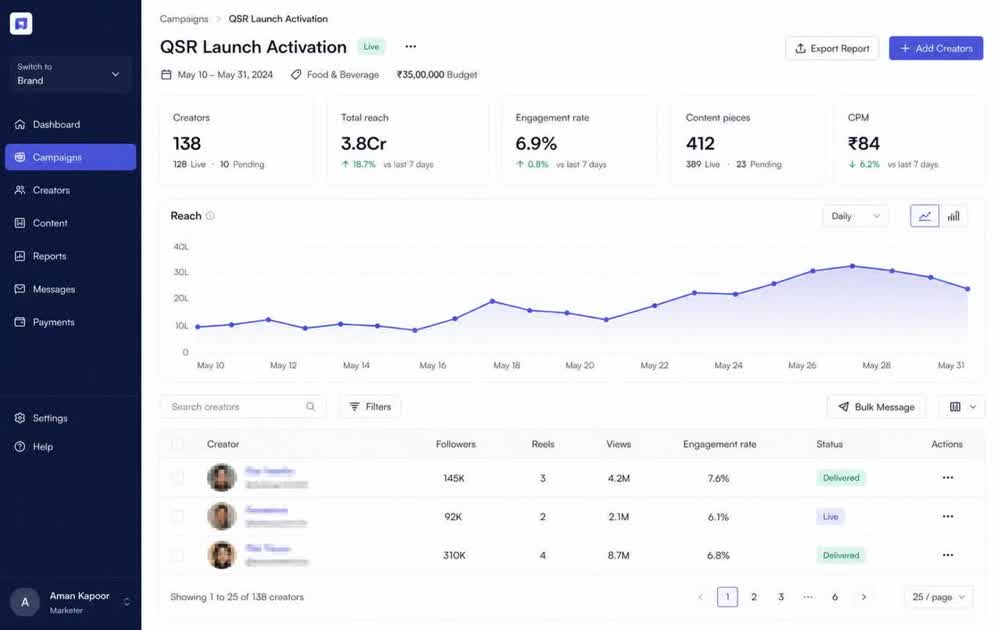
    Live campaign view from our creator management platform: 138 creators live, 3.80Cr reach, 6.9% average engagement and ₹142 CPM, with engagement running 9.4% on nano and 6.2% on macro tiers.

    Source: Creator management platform, campaign dashboard

    Instagram professional dashboard, 90 day view

    Instagram professional dashboard, 90 day view

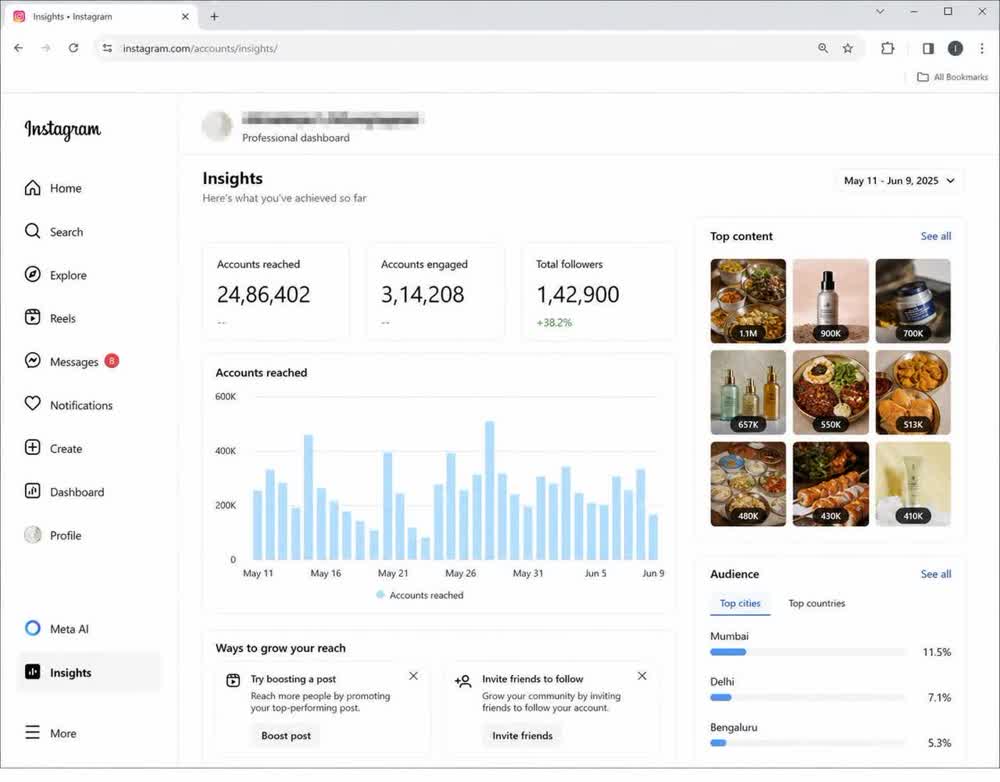
    Native Instagram insights on a handle we manage: 2,14,32,180 accounts reached, 14,82,340 accounts engaged and 1,84,220 followers, with Reels driving 72.6% of reach and top posts between 5.4M and 12.3M views.

    Source: Instagram professional dashboard

    Reel insights, single creator collaboration

    Reel insights, single creator collaboration

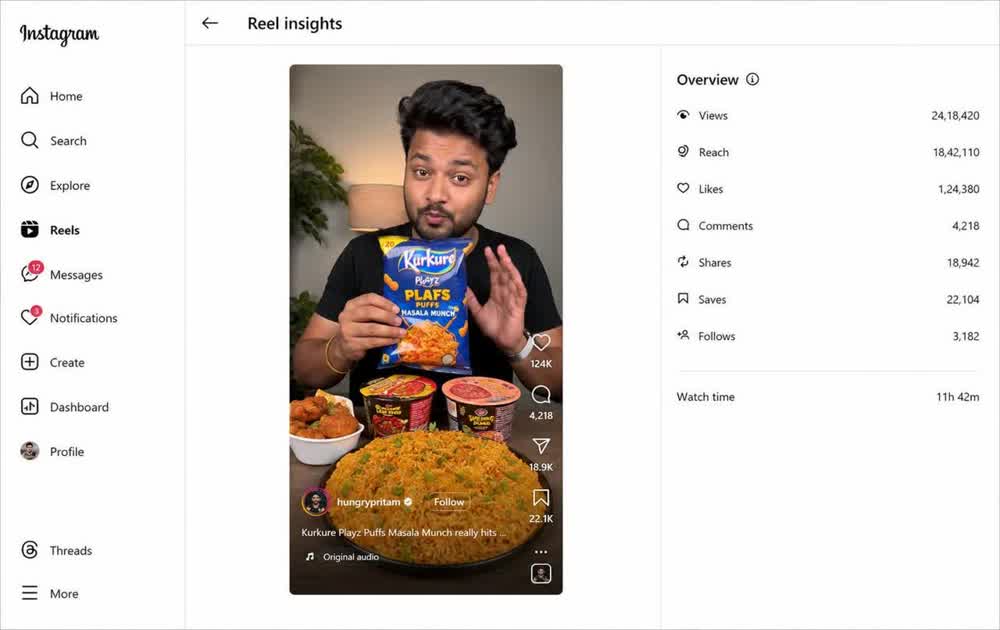
    One collaboration reel from the food creator programme: 24,18,420 views, 18,42,110 reach, 1,24,380 likes, 18,942 shares, 22,104 saves and 3,182 follows from a single post.

    Source: Instagram reel insights

    Brand handle, reels grid and profile growth

    Brand handle, reels grid and profile growth

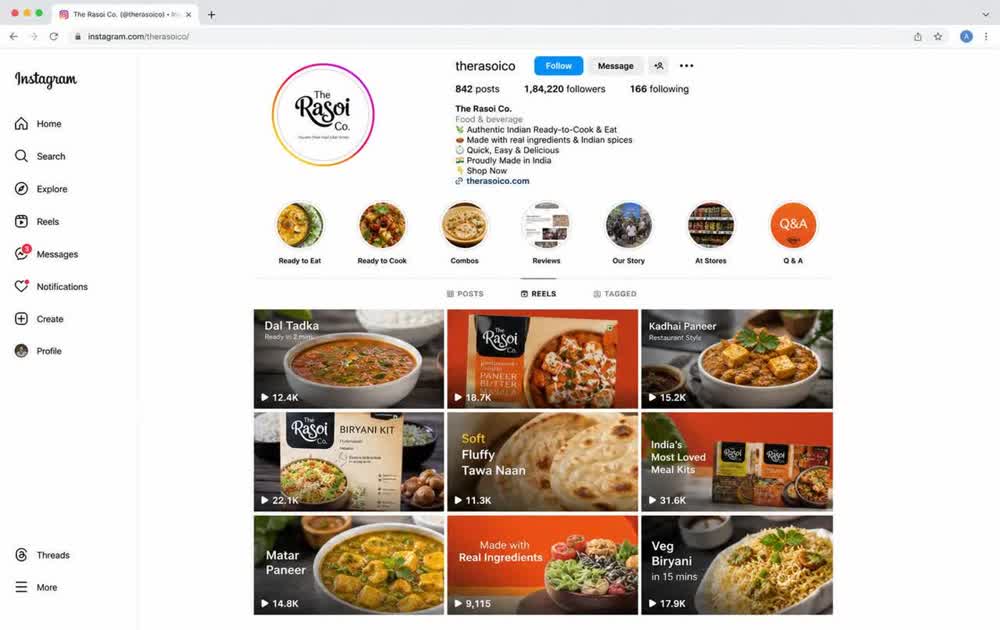
    The published output on a food brand handle we run end to end: 842 posts, 1,84,220 followers and a reels grid where recipe and product films consistently clear 10K to 30K views each.

    Source: Instagram profile, reels tab

    Creator campaign tracker, city and tier level

    Creator campaign tracker, city and tier level

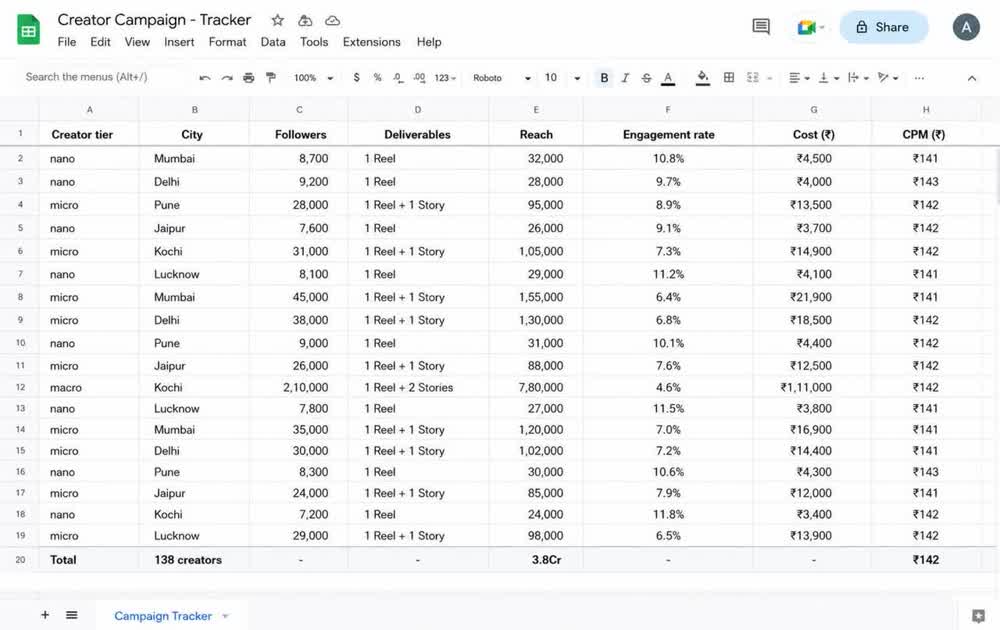
    The working tracker behind a 138 creator activation: tier, city, followers, deliverables, reach, engagement rate, cost and CPM per creator, rolling up to 3.8Cr reach at a blended ₹142 CPM.

    Source: Campaign tracker, live sheet

    YouTube Studio, shorts and long form growth

    YouTube Studio, shorts and long form growth

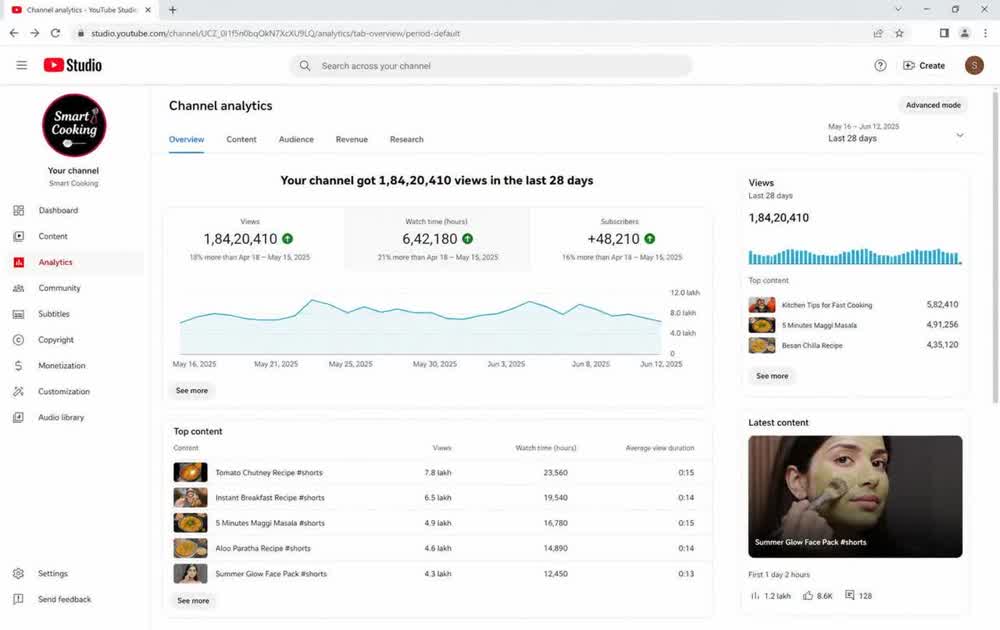
    Channel analytics on a brand channel: 1,84,20,410 views, 6,42,180 watch hours and 48,210 new subscribers in 28 days, driven by recipe and how to shorts produced in the same content batches.

    Source: YouTube Studio, channel analytics

    Stories insights, weekly narrative performance

    Stories insights, weekly narrative performance

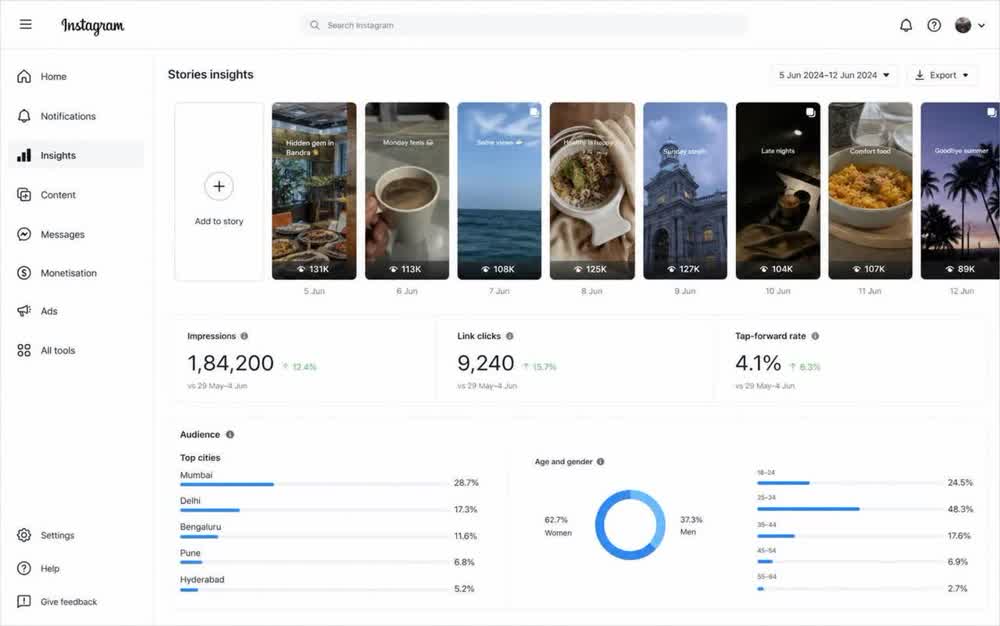
    Seven days of daily stories on a brand handle: 1,84,200 impressions, 9,240 link clicks and a 4.1% tap forward rate, with Mumbai, Delhi and Bengaluru leading the audience split.

    Source: Instagram Insights, stories

    Case snapshots

    Real engagements, anonymised by brand name at client request.

    Snacks & Confectionery

    Instagram / YouTube Shorts

    Challenge. Posting inconsistently with product only content, stuck at 4,000 followers and under 1% engagement.

    What we did. Shifted to a three pillar content system of product, behind the scenes and category education, moved to 20 reels per month, and built a comment response routine within two hours of posting.

    Outcome. Grew to 71,000 followers in eight months with engagement holding at 7.2% and a measurable lift in quick commerce search volume.

    4K → 71K

    Followers

    0.9% → 7.2%

    Engagement

    2.1M

    Monthly reach

    Skincare Brand

    Content Engine

    Challenge. Creative bottleneck. Ads, marketplace banners and social all competed for the same tiny asset pool, so everything looked repetitive.

    What we did. Built a monthly shoot and edit pipeline producing 180 assets a month across static, reel, marketplace A+ and story formats from a single production day.

    Outcome. Creative refresh cadence went from quarterly to fortnightly, ad fatigue dropped sharply and CTR improved 62%.

    22 → 180

    Assets / month

    +62%

    Ad CTR

    -48%

    Cost per asset

    Home Care Brand

    WhatsApp & Email

    Challenge. A 60,000 contact list sitting completely unused with no retention programme in place.

    What we did. Launched segmented WhatsApp and email flows: welcome, replenishment reminders, win back and a VIP tier for high frequency buyers.

    Outcome. Retention channels now drive 24% of monthly revenue at a fraction of paid acquisition cost.

    24%

    Revenue from retention

    +37%

    Repeat rate

    11x

    Channel ROI

    Pizza Hut

    Influencer Marketing

    Challenge. A limited time QSR launch needed burst reach and footfall into stores and delivery within a two week window, but the category creator space was crowded and noisy.

    What we did. Ran a curated influencer mix of 138 food and lifestyle creators across Instagram Reels and YouTube Shorts, briefed around a single hook and a location aware call to action, with a creator led story chain that ran in sequence.

    Outcome. 3.8Cr cumulative reach in the campaign window, a 6.9% engagement rate on creator content and a measurable spike in delivery app orders during the activation period.

    3.8Cr

    Reach

    6.9%

    Engagement rate

    138

    Creators activated

    Domino's

    Influencer Marketing

    Challenge. Sustaining order frequency between major promotional windows with organic social that did not feel like paid advertising.

    What we did. Built an always on creator programme with 28 nano and micro creators producing weekly order to unbox content, paired with reactive content tied to match days and pay day weekends.

    Outcome. Creator content became the highest performing organic format on the handle, branded search stayed elevated between campaigns and cost per content piece dropped 52% versus one off campaigns.

    +220%

    Organic reach

    -52%

    Cost per content

    28

    Always on creators

    Frequently asked questions

    How many posts per month do you produce?+

    A typical retainer covers 16 to 24 reels, 12 to 20 statics and daily stories, plus marketplace and ad assets from the same production pipeline. Volume is set to your category and budget.

    Do you handle shooting or only editing?+

    Both. We run production days at studio or on location and handle the full pipeline through to scheduled publishing.

    How long until follower growth compounds?+

    Expect the first meaningful inflection between month three and month four. Growth before that is usually noise from a single post rather than a working system.

    Want results like these?

    Share your category and current numbers, and we'll tell you honestly what's achievable and how long it takes.

    Request a review