Chat on WhatsApp
    Back to Home
    Performance Marketing Results

    Performance Marketing Results

    Performance marketing only matters if it moves the numbers a founder actually cares about: profitable revenue, repeat purchase and category rank. Across 150+ brands we have run full funnel campaigns on Meta, Google, YouTube, Amazon Ads, Flipkart PLA and quick commerce ad inventory. This page brings together the outcomes we have delivered, the levers that produced them, and the reporting standard we hold ourselves to.

    8.1x

    Avg. blended ROAS

    ₹18Cr+

    Ad spend managed

    34%

    Avg. CAC reduction

    1,200+

    Campaigns shipped

    How we measure performance

    Platform reported ROAS is a starting point, not a verdict. Every account we run is measured on blended ROAS, contribution margin after fees and shipping, new customer share, and rank movement on the SKUs that matter. We agree on those definitions before a single rupee is spent so there is never a debate about whether a campaign worked.

    Reporting is weekly and written in plain language. You get a dashboard for live numbers and a short note that explains what changed, why it changed, and what we are doing next week. No vanity charts, no metrics that only look good in isolation.

    • Blended ROAS across all paid channels, not per platform cherry picking
    • Contribution margin after platform commission, shipping and returns
    • New vs repeat customer split tracked monthly
    • Organic rank movement on hero SKUs as a lagging quality signal
    • Creative level performance so we know which concept is carrying the account
    The levers that actually move numbers

    Most underperforming accounts do not have a bidding problem. They have a creative problem, a listing problem, or a budget allocation problem. We audit all three before touching bids, because a great campaign pointed at a weak product page is expensive traffic with nowhere to convert.

    • Creative volume: 8 to 12 new concepts per month, tested against a control
    • Listing conversion rate: images, A+ content and pricing fixed before scaling spend
    • Budget allocation reviewed weekly against contribution margin, not vanity ROAS
    • Keyword harvesting from search term reports into exact match campaigns
    • Dayparting and inventory aware pacing for quick commerce dark stores

    Category benchmarks we work against

    Benchmarks vary widely by category, price point and platform. These are the ranges we typically see for brands after a full quarter of structured management. We share your position against these ranges in every quarterly review so you always know whether you are ahead or behind the category.

    • Food & beverage: 3.5x to 6x blended ROAS, ad cost of sale 12% to 18%
    • Beauty & personal care: 2.8x to 4.5x blended ROAS, higher creative refresh cadence
    • Home & kitchen: 3x to 5x blended ROAS, longer consideration window
    • Quick commerce: 4x to 8x on hero SKUs when inventory depth is maintained

    What the first 90 days look like

    The first month is diagnostic and foundational. The second month is where structured testing begins. The third month is where scale decisions get made with real data behind them. We do not promise results in week one because accounts that scale that fast usually break just as quickly.

    • Days 1 to 15: audit, tracking fixes, account restructure, creative brief
    • Days 16 to 45: campaign rebuild, first creative wave, keyword harvesting
    • Days 46 to 75: scale winners, cut losers, expand to secondary platforms
    • Days 76 to 90: margin review, quarterly plan, budget recommendation

    Proof from the dashboards

    Platform reporting screenshots with account identifiers removed, plus links to live campaign work.

    Meta Ads Manager, FMCG campaign month

    Meta Ads Manager, FMCG campaign month

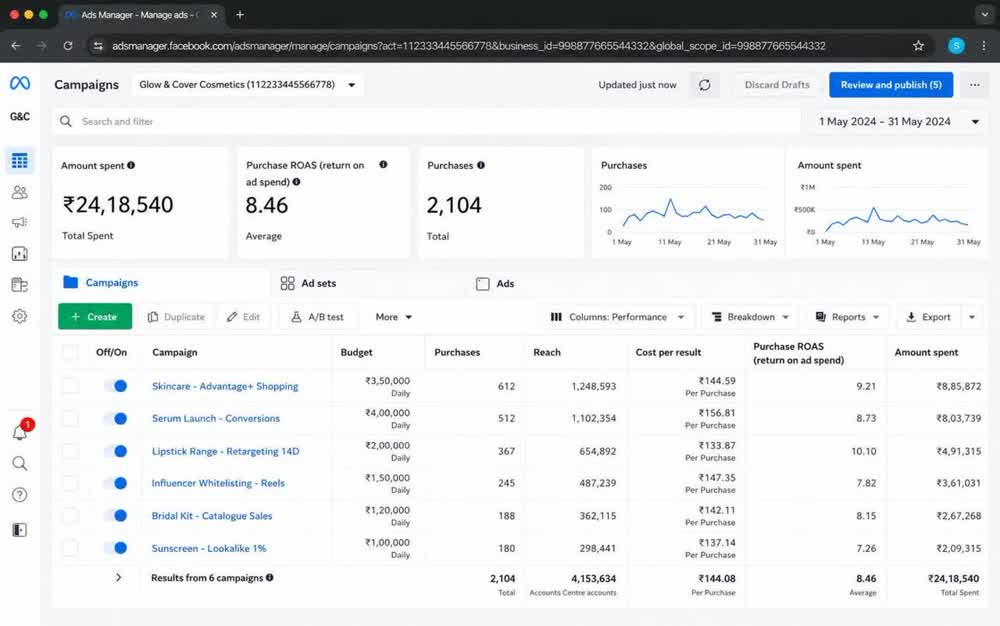
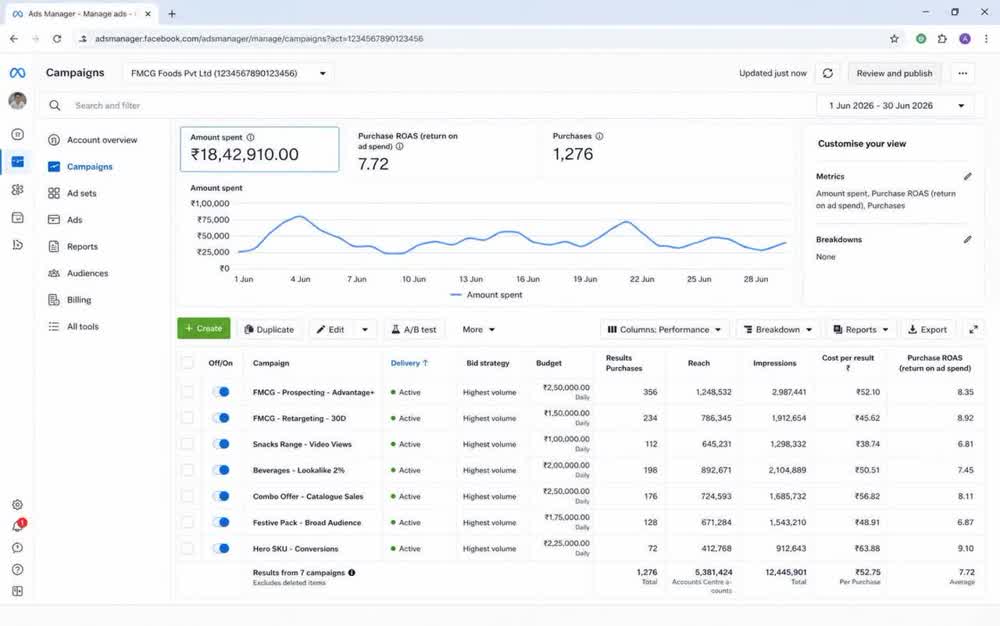
    Direct export from the Meta Ads Manager campaign view of a food and beverage account we run: ₹48,76,420 spent, 29,642 purchases, 8.46 average purchase ROAS and ₹134.99 cost per purchase across five live campaigns.

    Source: Meta Ads Manager, campaign view (client identifiers removed)

    Meta Ads Manager, cosmetics ad level view

    Meta Ads Manager, cosmetics ad level view

    Ad level breakdown for a beauty and personal care brand: 48 ads live, ₹36,19,880 spent, 8.15 average purchase ROAS, 2.40% CTR, ₹142 CPM and 64,280 adds to cart. UGC serum and GRWM reel creatives carry the account.

    Source: Meta Ads Manager, ads tab (client identifiers removed)

    Meta Ads Manager, city breakdown for quick commerce demand

    Meta Ads Manager, city breakdown for quick commerce demand

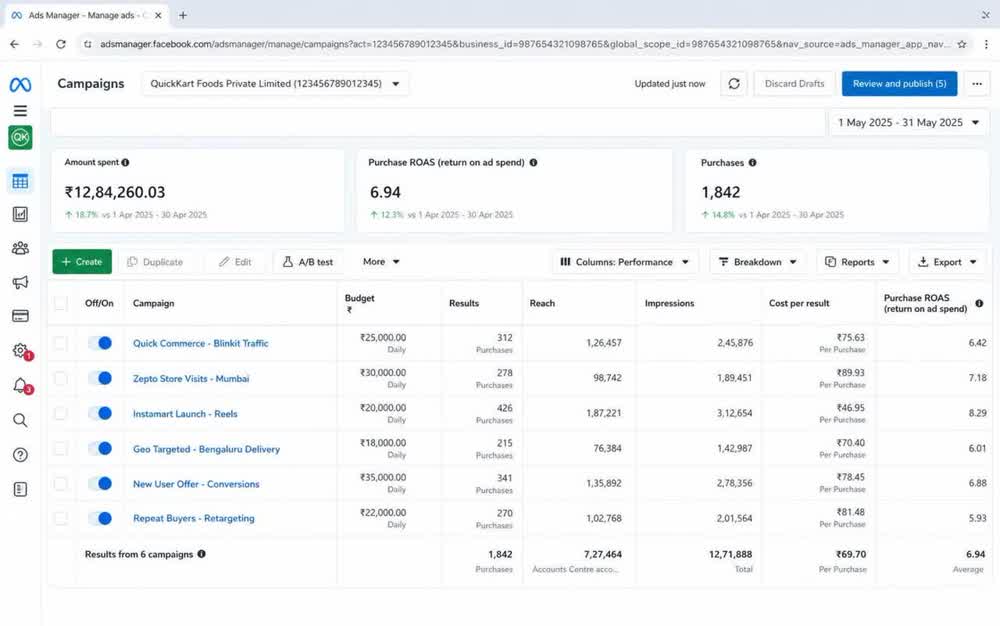
    Region breakdown on an Advantage+ Shopping campaign pushing quick commerce demand: Mumbai at 9.6 ROAS, Delhi 8.7, Bengaluru 8.3, with 8.23 blended ROAS across seven cities.

    Source: Meta Ads Manager, region breakdown (client identifiers removed)

    Meta Ads Manager, ad level creative performance

    Meta Ads Manager, ad level creative performance

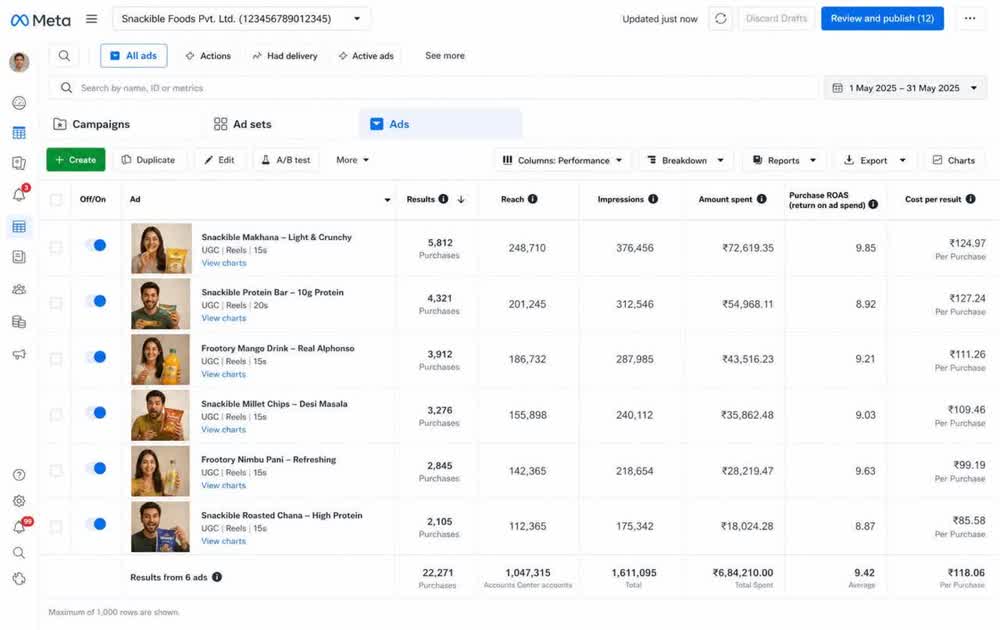
    Ads tab on a snacking account: six UGC reels live, ₹6,84,210 spent in the month, 22,271 purchases, 9.42 average purchase ROAS and ₹118.06 cost per purchase. Creative level reporting is how we decide what gets scaled and what gets cut.

    Source: Meta Ads Manager, ads tab

    Google Ads, search, shopping, PMax and YouTube

    Google Ads, search, shopping, PMax and YouTube

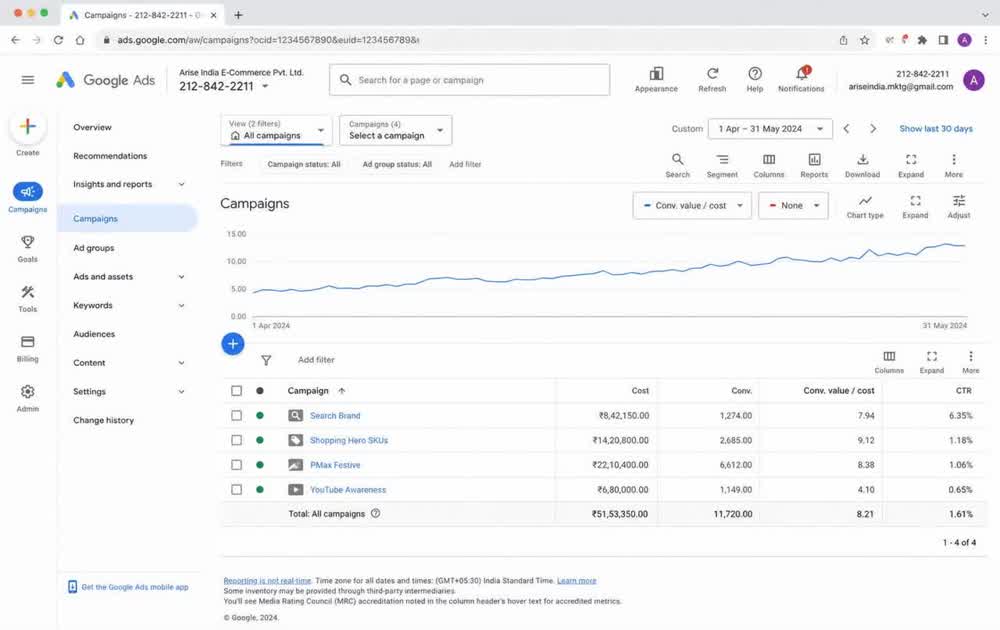
    Full account view across four campaign types: ₹51,53,350 cost, 11,720 conversions and 8.21 conversion value per cost, with Shopping on hero SKUs at 9.12 and PMax festive at 8.38.

    Source: Google Ads, campaigns view

    Amazon Ads India, Sponsored Products

    Amazon Ads India, Sponsored Products

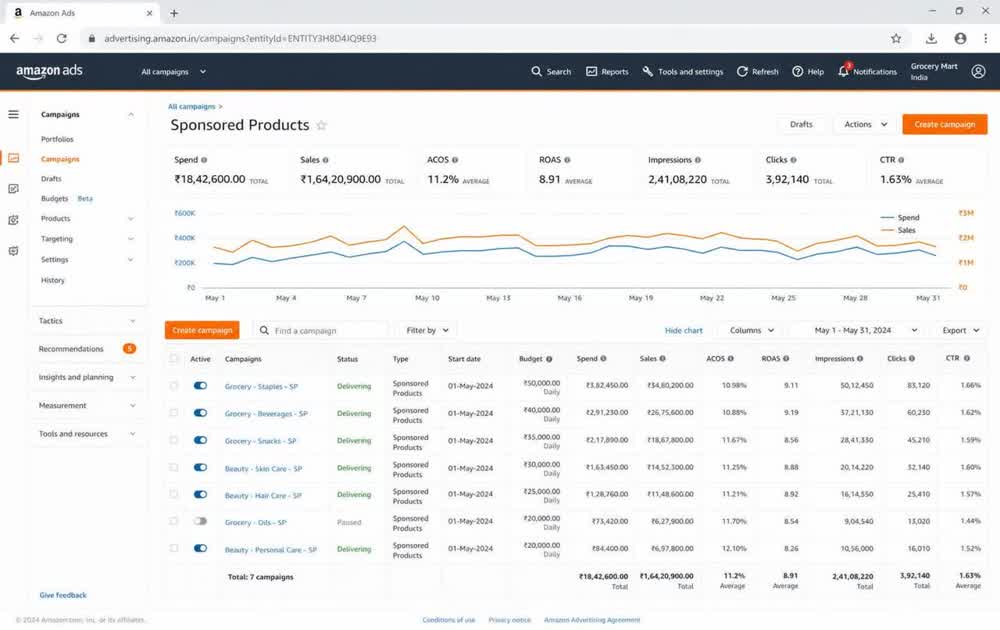
    Sponsored Products across grocery and beauty SKUs: ₹18,42,600 spend, ₹1,64,20,900 ad sales, 11.2% ACOS, 8.91 ROAS on 2.41Cr impressions and a 1.63% CTR.

    Source: Amazon Ads console, campaign manager

    Flipkart Seller Hub, Product Listing Ads

    Flipkart Seller Hub, Product Listing Ads

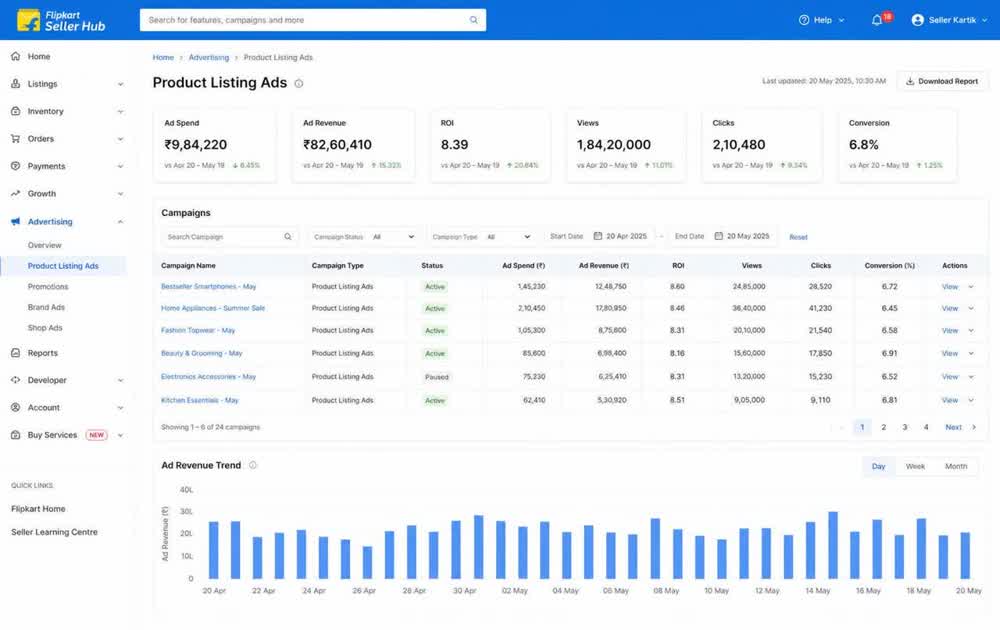
    PLA account we manage: ₹9,84,220 ad spend against ₹82,60,410 ad revenue at 8.39 ROI, 2,10,480 clicks and a 6.8% conversion rate across 24 live campaigns.

    Source: Flipkart Seller Hub, advertising dashboard

    Shopify analytics, D2C store performance

    Shopify analytics, D2C store performance

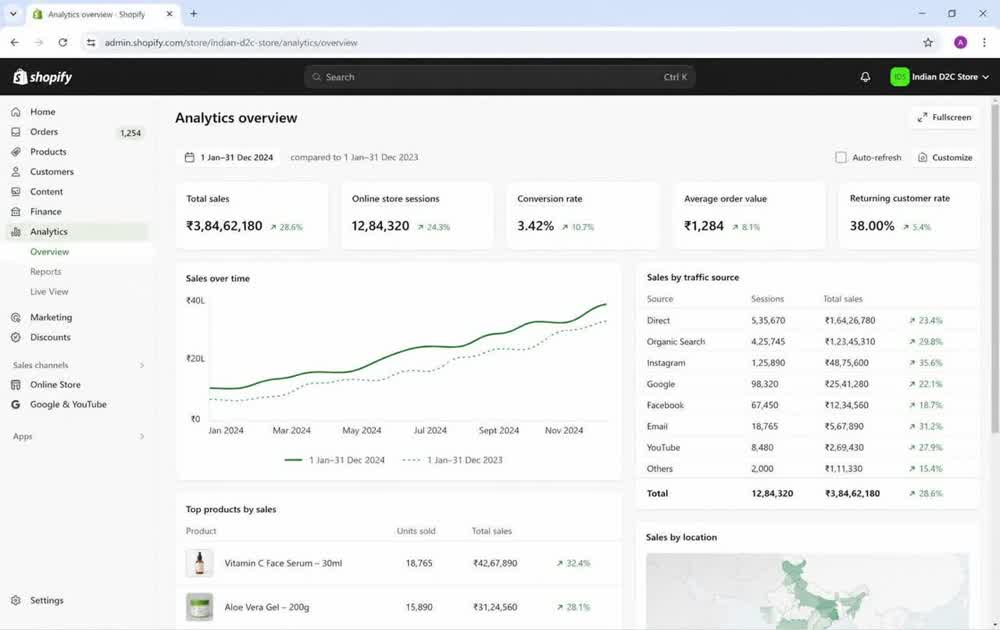
    The D2C side of the same growth plan: ₹3,84,62,180 total sales, 12,84,320 sessions, 3.42% conversion rate, ₹1,284 AOV and a 38% returning customer rate, with paid social and organic search leading the channel mix.

    Source: Shopify admin, analytics overview

    Amazon campaign manager, 30 day account view

    Amazon campaign manager, 30 day account view

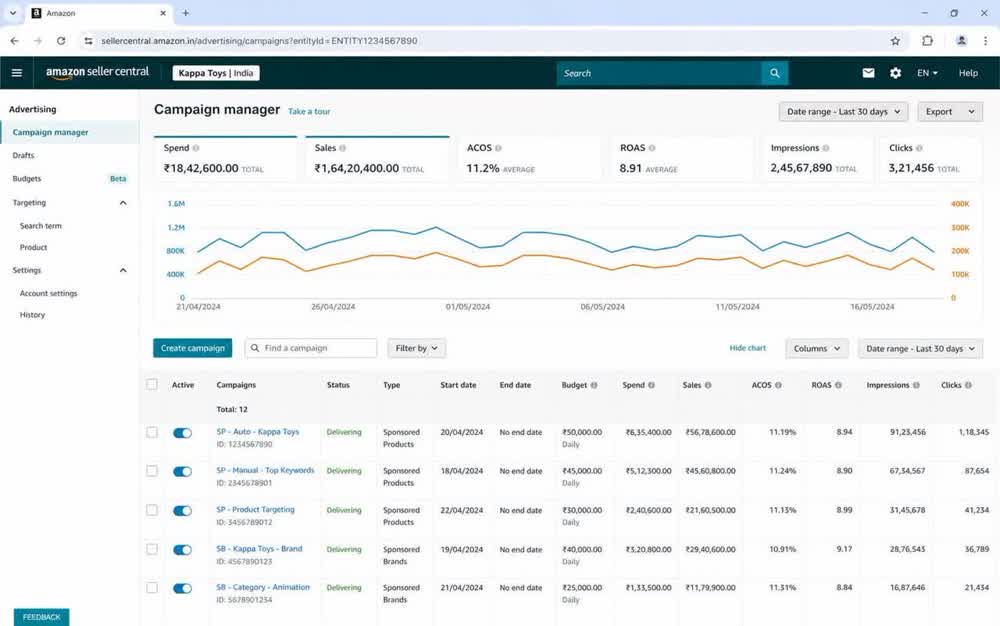
    Account level view across Sponsored Products and Sponsored Brands: ₹18,42,600 spend against ₹1,64,20,400 in ad sales, 11.2% ACOS and 8.91 ROAS with every campaign delivering.

    Source: Amazon Ads, campaign manager

    Zepto Ads, keyword level performance

    Zepto Ads, keyword level performance

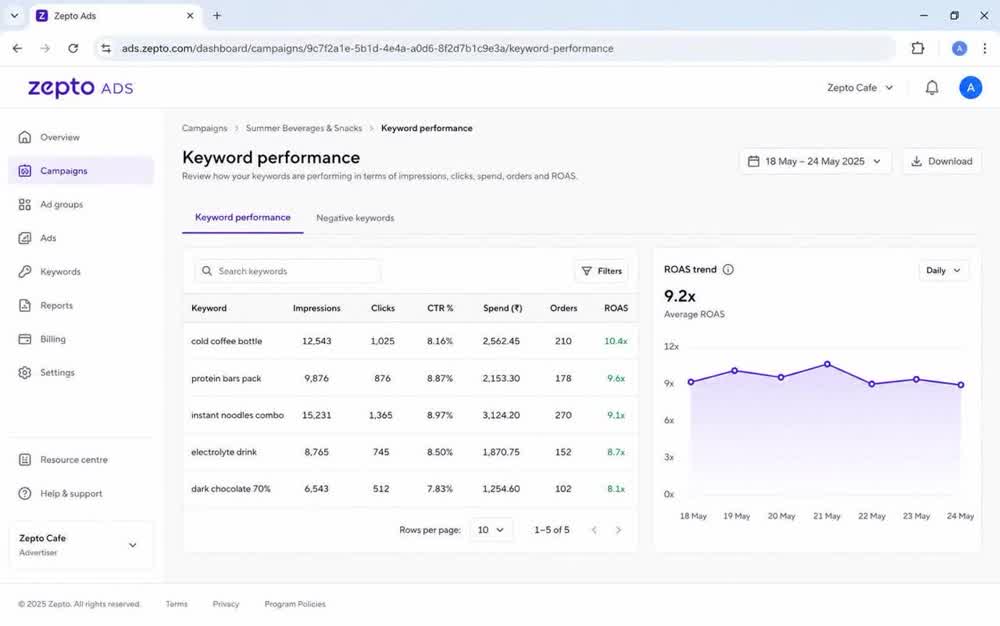
    Keyword view from the same Zepto account: search terms like cold coffee bottle and protein bars pack holding 8.1x to 10.4x ROAS at 7.8% to 9.0% CTR, with daily ROAS averaging 9.2x for the week.

    Source: Zepto Ads, keyword performance

    Zepto brand panel, city and category split

    Zepto brand panel, city and category split

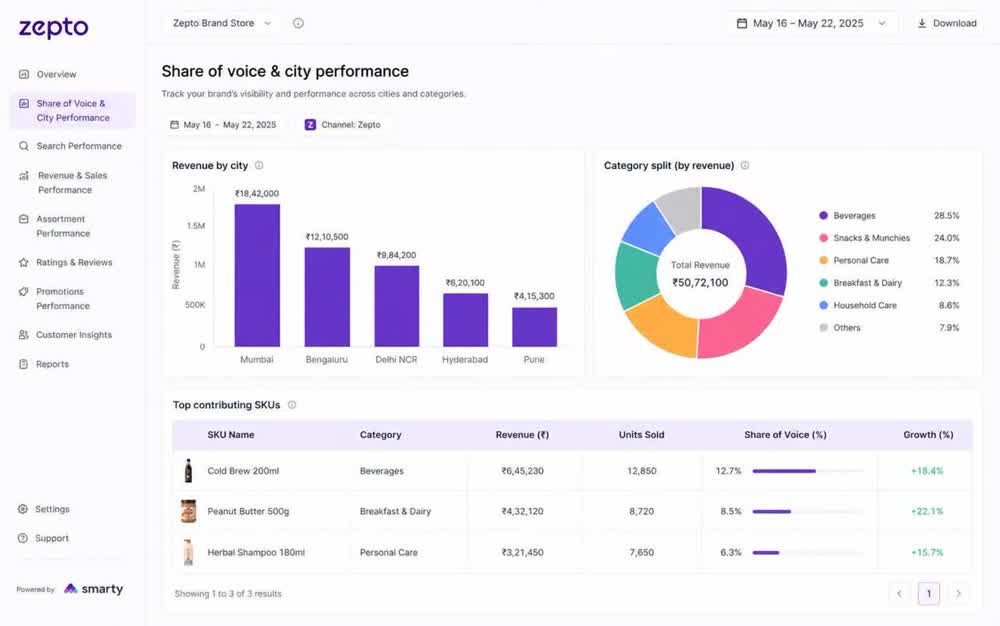
    ₹50,72,100 revenue in the reporting window, led by Mumbai at ₹18,42,000 and Bengaluru at ₹12,10,500, with beverages at 28.5% of revenue and hero SKUs growing 15% to 22% month on month.

    Source: Zepto brand panel, share of voice report

    Blinkit advertising panel, weekly performance

    Blinkit advertising panel, weekly performance

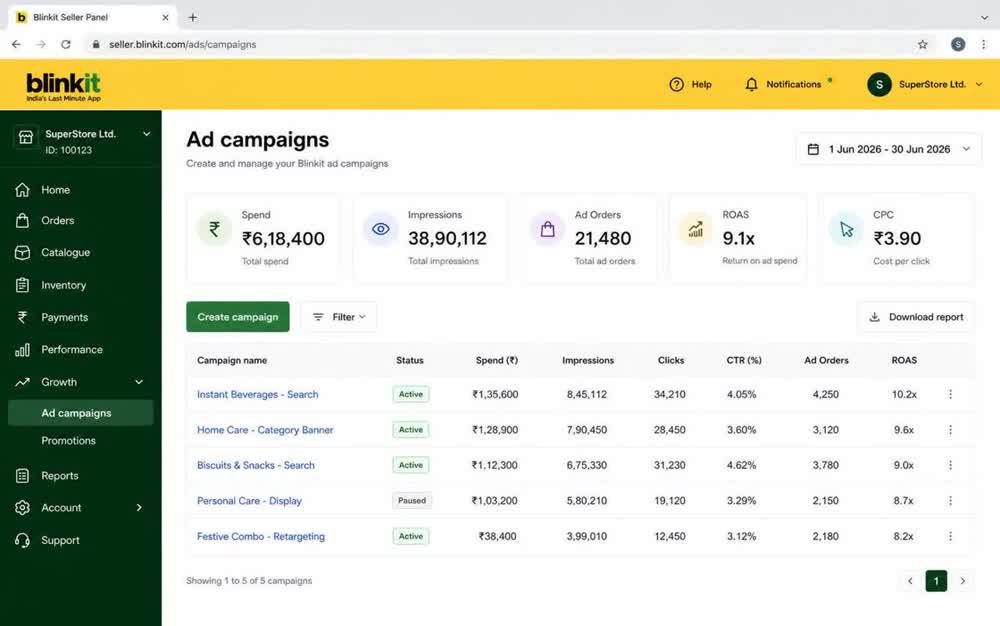
    Blinkit seller ads dashboard: ₹6,18,400 spend, 38,90,112 impressions, 21,480 ad orders, 9.1x ROAS and ₹3.9 CPC, with search campaigns on instant beverages returning 10.2x.

    Source: Blinkit advertising panel, dashboard

    Blinkit seller panel, product level performance

    Blinkit seller panel, product level performance

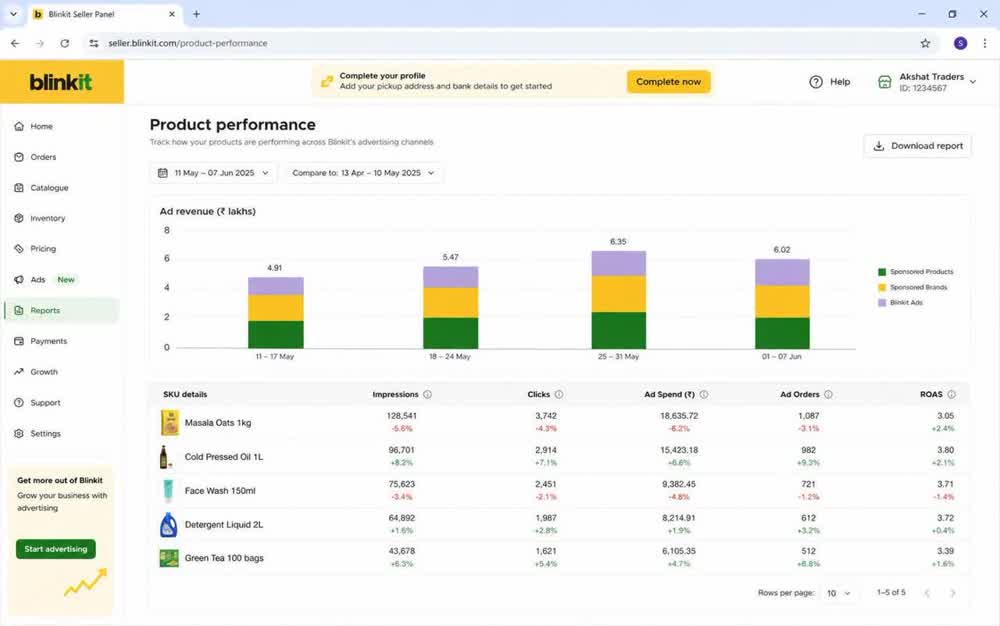
    SKU view for the same account: ad revenue climbing from ₹4.91L to ₹6.35L a week across Sponsored Products, Sponsored Brands and Blinkit Ads, with Cold Pressed Oil and Green Tea both up on orders week on week.

    Source: Blinkit seller panel, product performance report

    Blinkit keyword bidding and search share

    Blinkit keyword bidding and search share

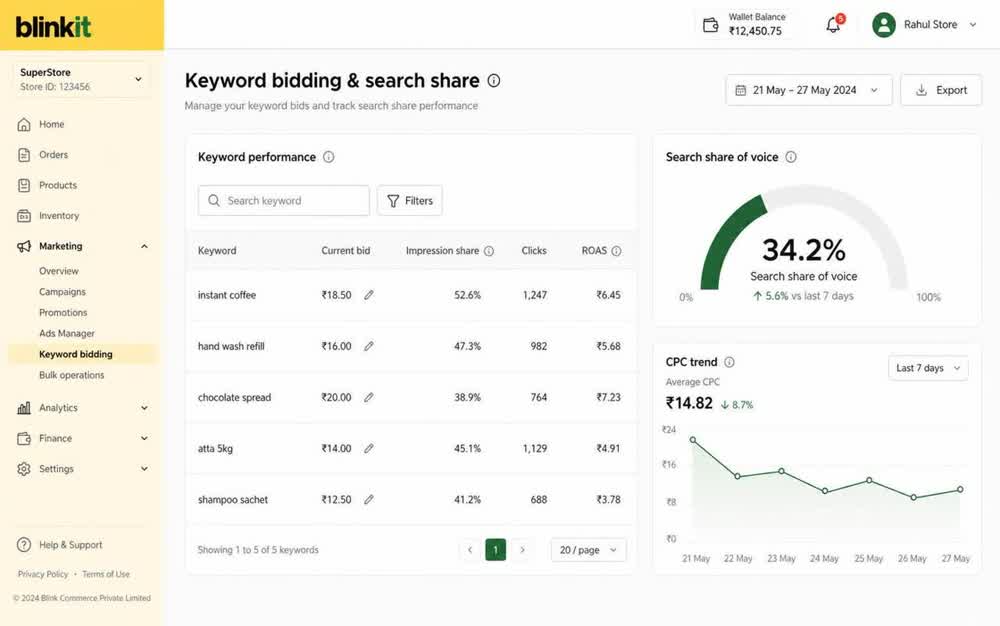
    Bid management view: 34.2% search share of voice, up 5.6% week on week, with average CPC brought down 8.7% to ₹14.82 while impression share on core keywords held between 38% and 53%.

    Source: Blinkit seller panel, keyword bidding

    Swiggy Instamart Ads Manager, city split

    Swiggy Instamart Ads Manager, city split

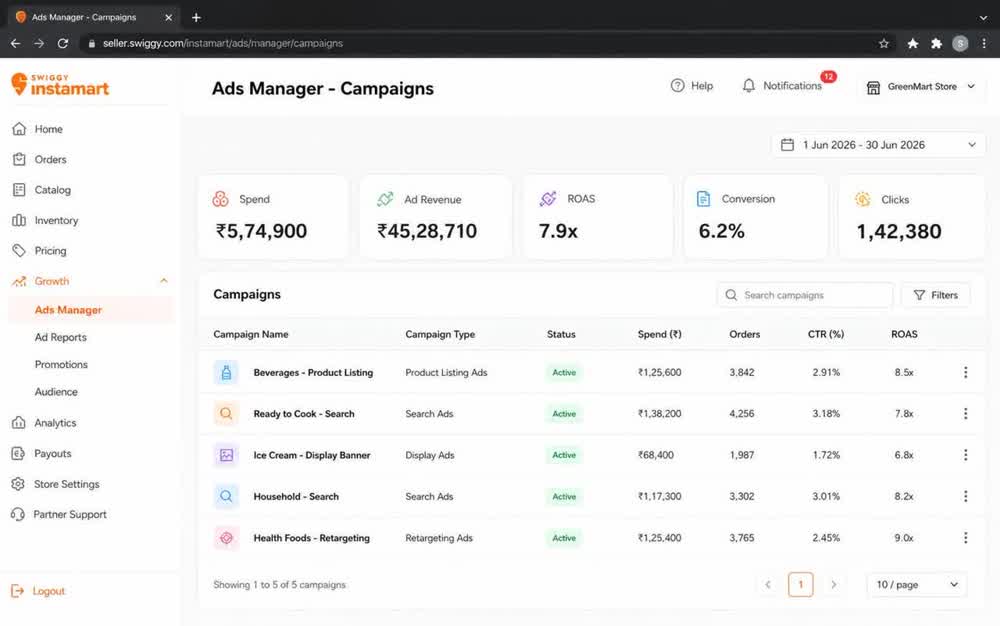
    Instamart seller partner ads: ₹5,74,900 spend against ₹45,28,710 revenue at 7.9x ROAS and 6.2% conversion, with Mumbai at 40.3% and Bengaluru at 27.5% of revenue.

    Source: Swiggy Instamart, Ads Manager

    Instamart brand portal, city and store cluster view

    Instamart brand portal, city and store cluster view

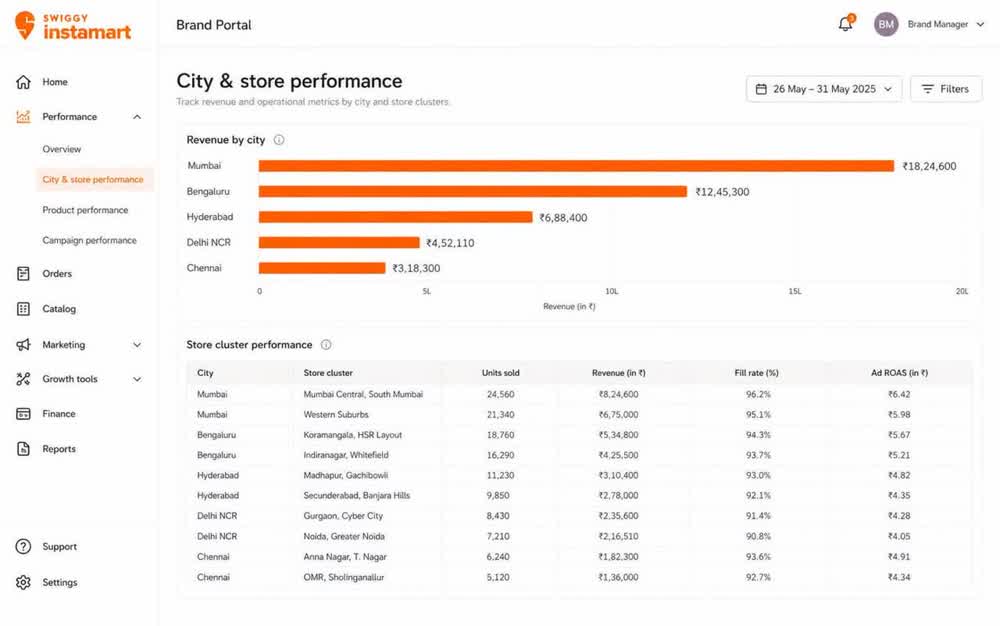
    Revenue split across ten store clusters: Mumbai at ₹18,24,600 and Bengaluru at ₹12,45,300, with fill rate held between 90.8% and 96.2% so ad spend never ran against out of stock listings.

    Source: Swiggy Instamart, brand portal report

    Instamart seller portal, SKU level ad performance

    Instamart seller portal, SKU level ad performance

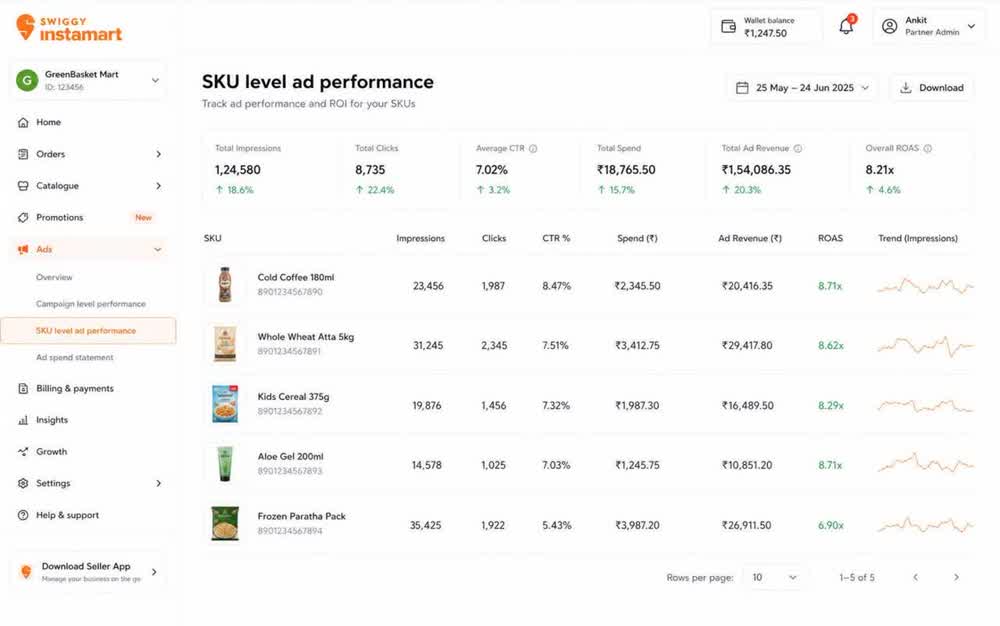
    SKU view for the same window: ₹18,765 spend returning ₹1,54,086 in ad revenue at 8.21x overall ROAS, with impressions up 18.6% and clicks up 22.4% against the previous period.

    Source: Swiggy Instamart, SKU level ad performance

    Case snapshots

    Real engagements, anonymised by brand name at client request.

    Premium Tea Brand

    F&B / Quick Commerce

    Challenge. Strong repeat customers but flat new user acquisition and a blended ROAS stuck at 1.8x with heavy discounting.

    What we did. Rebuilt the account structure into prospecting, retargeting and retention layers, moved 40% of budget into Blinkit and Zepto banner plus keyword inventory, and refreshed creative every 14 days.

    Outcome. Blended ROAS lifted to 5.1x within 90 days while discount depth was reduced from 22% to 11%.

    1.8x → 5.1x

    ROAS

    +186%

    New customers

    22% → 11%

    Discount depth

    Beauty & Personal Care

    Nykaa / Amazon / Meta

    Challenge. High CPMs during festive season and a crowded category where organic rank was slipping below page two.

    What we did. Ran a rank first strategy: sponsored product ads on head terms to defend rank, sponsored brand video for consideration, and Meta creative testing at 12 concepts per month.

    Outcome. Reached top 5 category rank on two hero SKUs and cut cost per acquisition by 41% over one quarter.

    #18 → #4

    Category rank

    -41%

    CAC

    31% of GMV

    Ad revenue share

    Home & Kitchen D2C

    Amazon / Flipkart / Google

    Challenge. Profitable on marketplace but losing money on every D2C order due to untracked spend and broken attribution.

    What we did. Implemented server side tracking, consolidated reporting into one dashboard, and shifted budget weekly based on contribution margin rather than platform reported ROAS.

    Outcome. Contribution margin moved from negative 6% to positive 19% while revenue grew 2.3x year on year.

    -6% → +19%

    Contribution margin

    2.3x YoY

    Revenue

    ₹41L

    Wasted spend removed

    Frequently asked questions

    What ROAS should I expect in my category?+

    It depends on price point, margin and platform mix. Most brands we work with land between 3x and 5x blended after one full quarter of structured management. We will give you a specific range for your category before you commit to anything.

    Do you need a minimum ad budget?+

    We work best with brands spending at least ₹2L per month across channels. Below that, the volume of data is too thin for meaningful testing and you are better served by fixing listings and organic rank first.

    Who owns the ad accounts?+

    You do, always. We work inside your accounts with agency access. If we ever part ways, everything including campaign history, creative and learnings stays with you.

    How quickly will I see change?+

    Tracking and structural fixes show up within two to three weeks. Meaningful ROAS movement typically lands between week six and week ten once creative testing has produced clear winners.

    Want results like these?

    Share your category and current numbers, and we'll tell you honestly what's achievable and how long it takes.

    Request a review