What goes into the dashboard
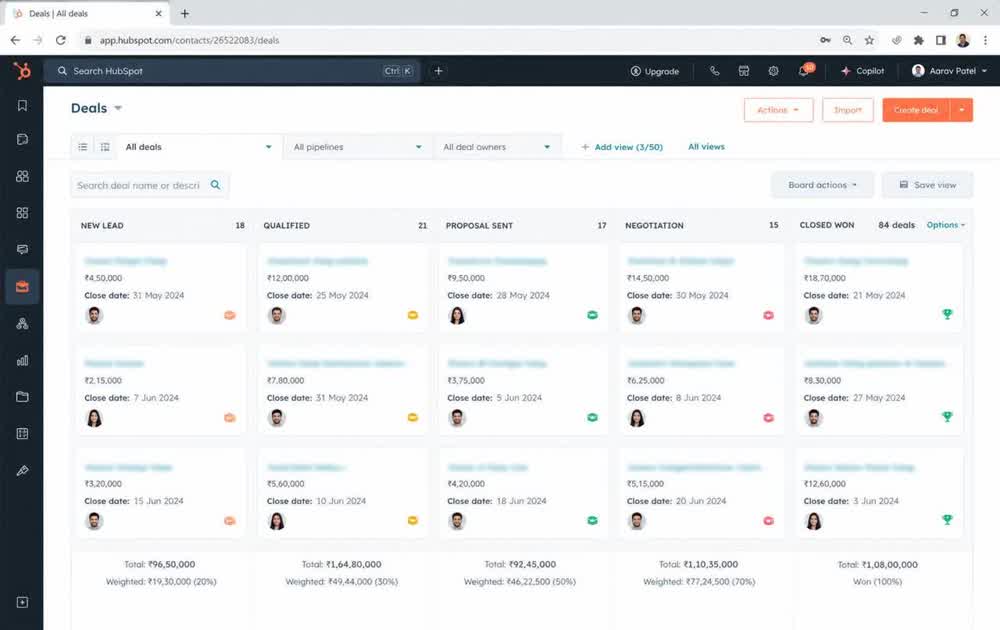
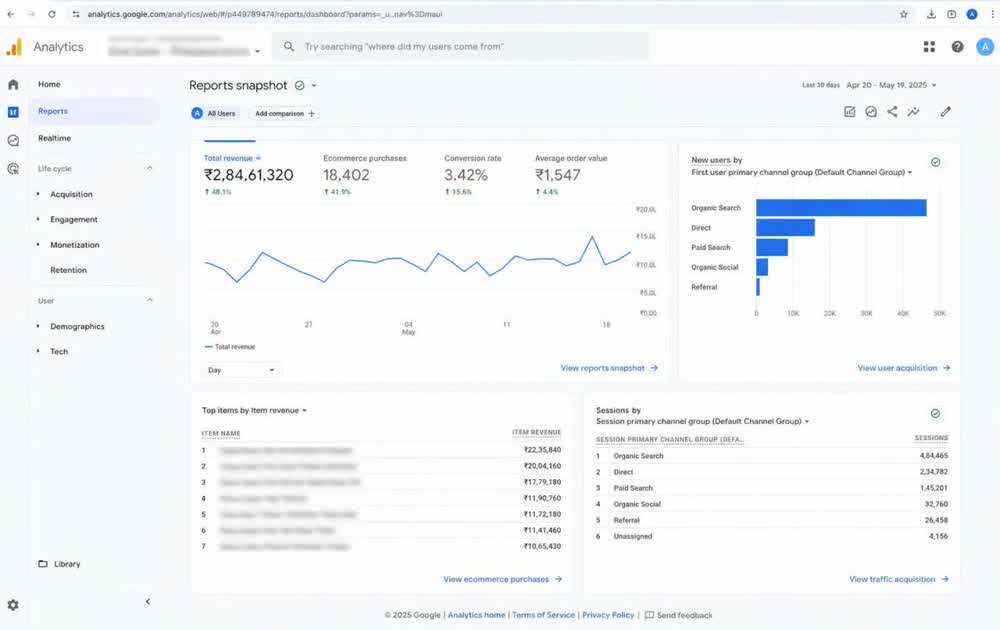
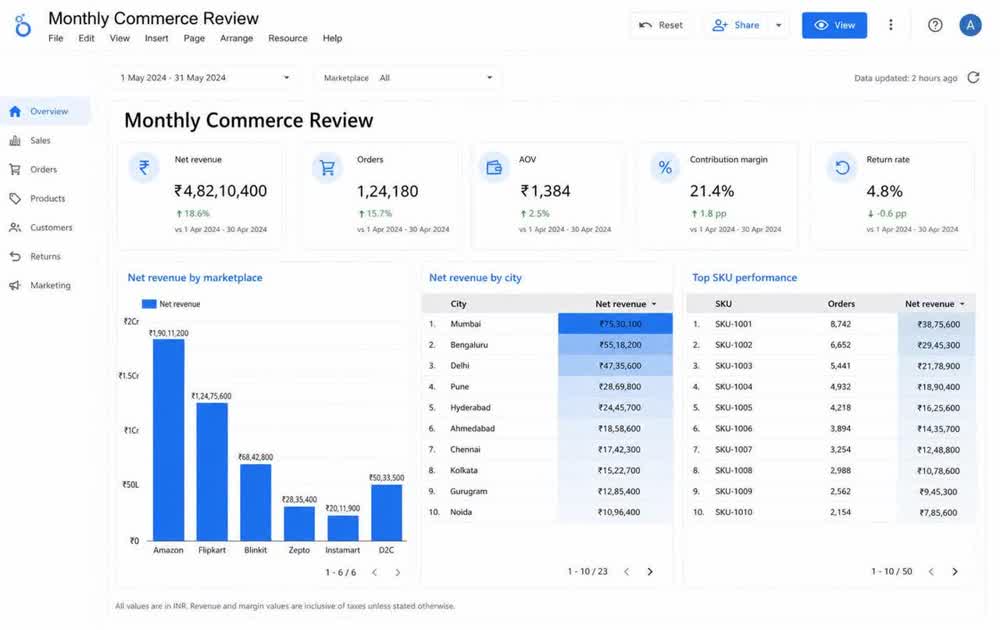
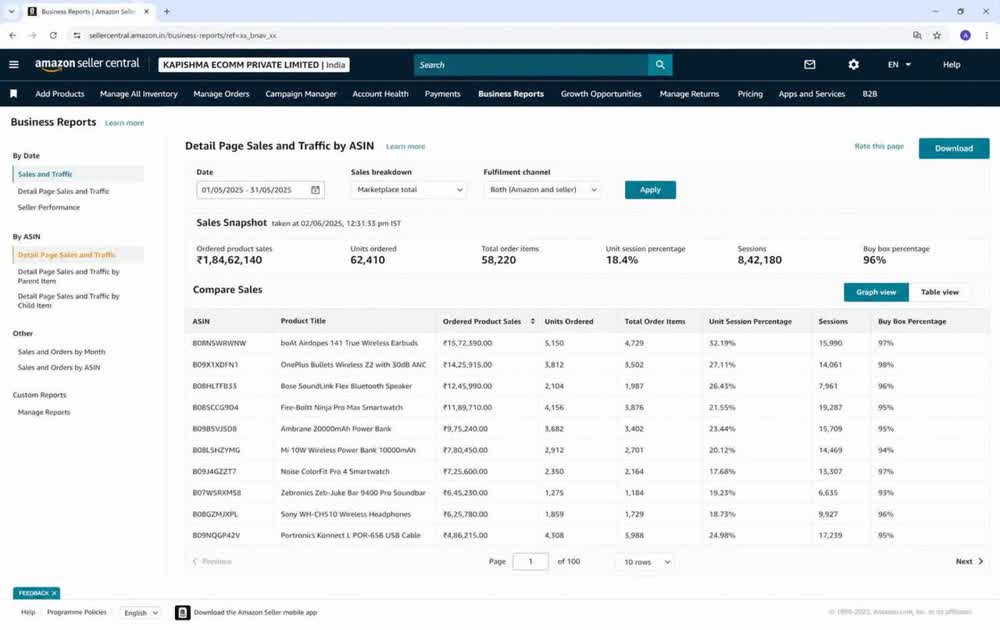
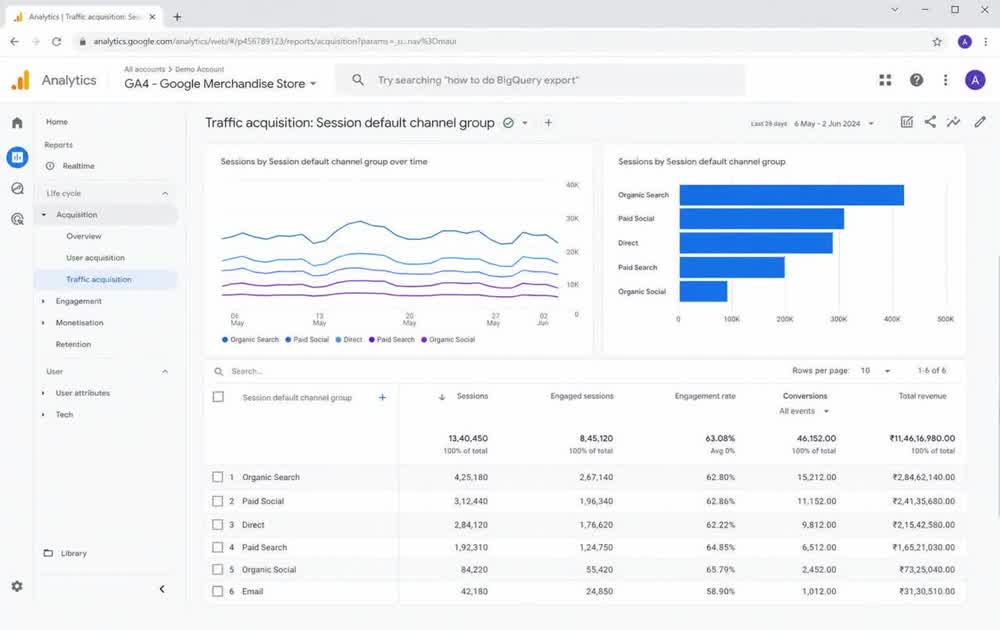
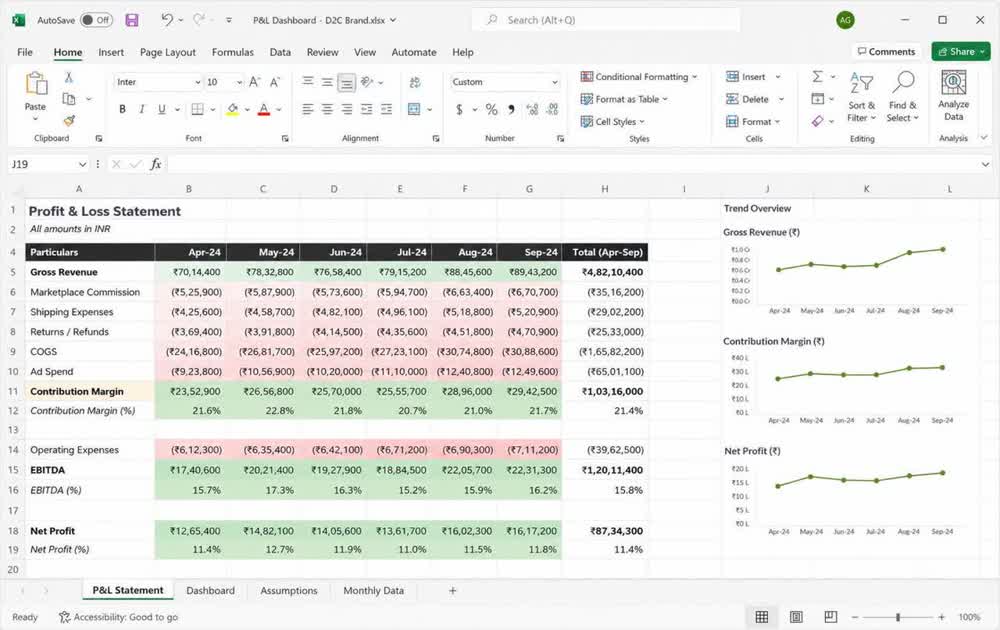
Every brand gets a dashboard built around its own economics rather than a generic template. The constant is the layer structure: revenue at the top, contribution in the middle, and operational leading indicators underneath so problems are visible before they show up in the P&L.
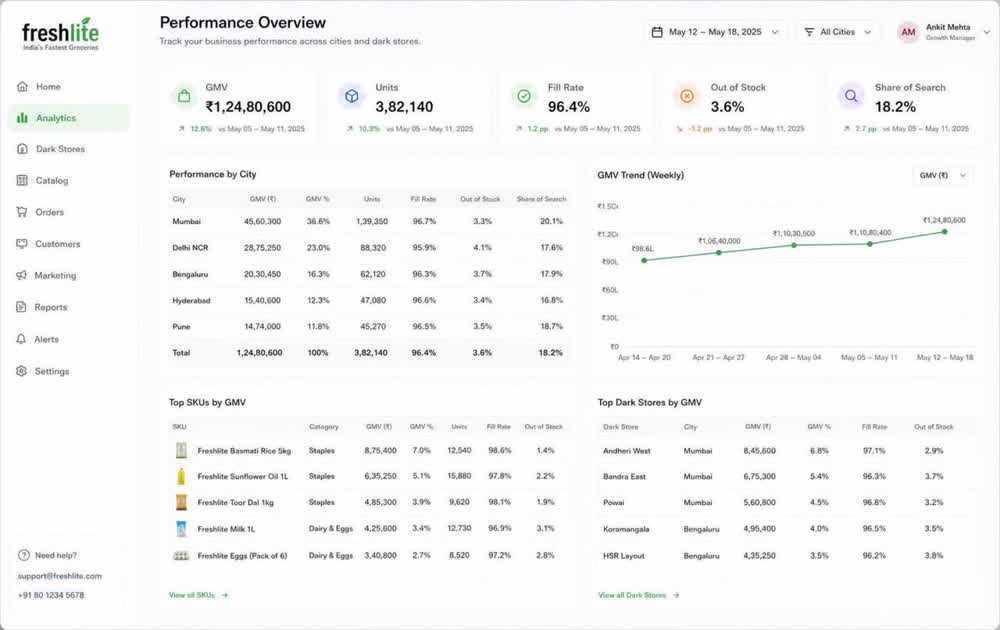
- Sales by platform, city and SKU with day on day and week on week comparison
- Contribution margin per SKU after commission, shipping, returns and ad spend
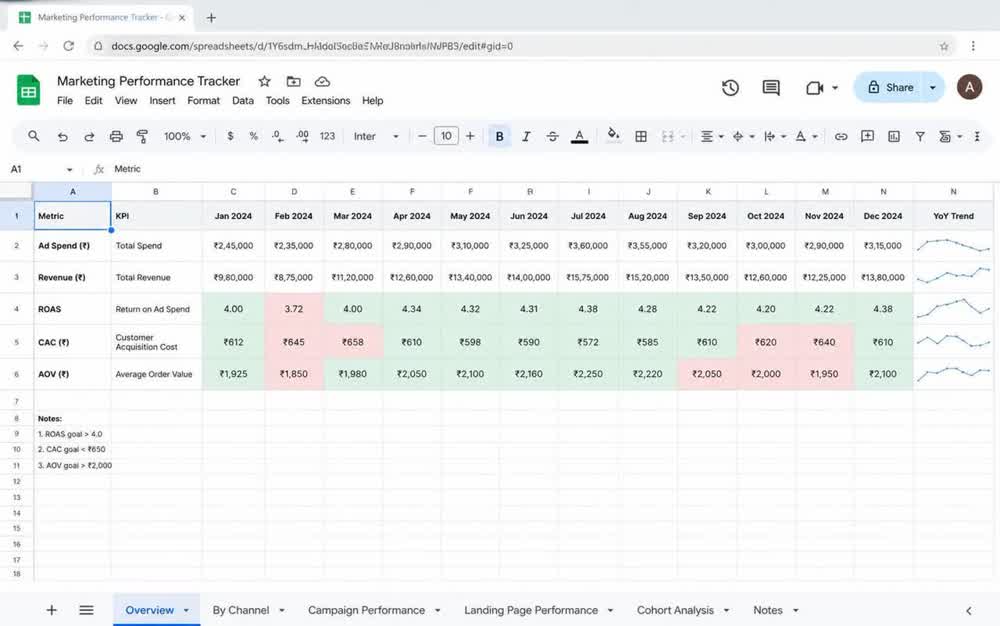
- ROAS and ad cost of sale by platform and campaign type
- Inventory days of cover with reorder alerts by warehouse and dark store
- Review rating and share of voice tracked alongside commercial metrics